Leveling Up Data Unveils New Logo
Check out our new logo at Leveling Up Data! This design shows our commitment to innovation. Celebrate this important moment in data solutions with us!
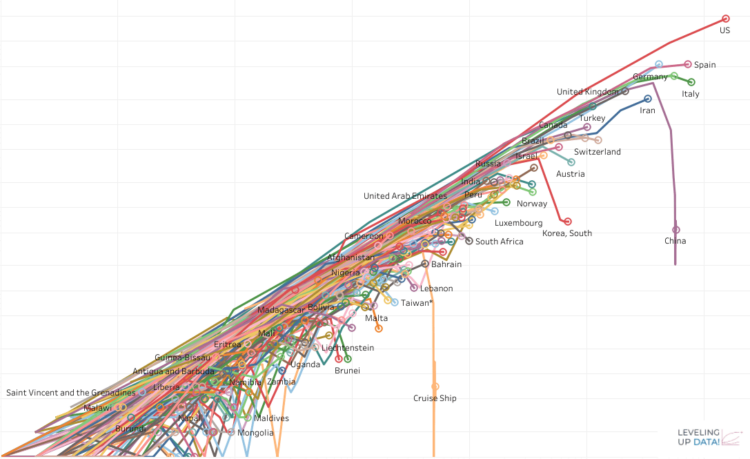
Which Countries Have Beaten Covid-19
Visualization that tries to explain if we’re winning the fight over covid. Shows countries that managed to flatten the curve. Tries to […]
Borders, Padding, and Custom Lines in Tableau
One of the nice things about Tableau is the ability to add borders and padding to your finished dashboard without one single […]
How to show/hide your filters in Tableau.
Discover the exciting new features in Tableau 2019.2 that make managing your filters a breeze! Gone are the days of complicated workarounds; now you can easily show or hide filters with the innovative Show/Hide container feature. Whether you're working with the Sample – Superstore data source or your own data, this guide will walk you through creating a sleek dashboard that maximizes space and enhances user experience. Learn how to add dimensions, customize buttons, and transform your visualizations into interactive masterpieces. Dive in to elevate your Tableau skills and streamline your dashboards!