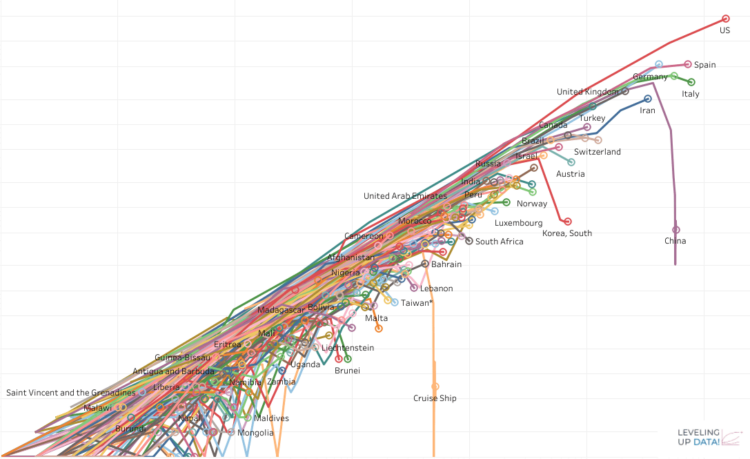
Visualization that tries to explain if we’re winning the fight over covid. Shows countries that managed to flatten the curve. Tries to answer the question, did social distancing or shelter in place have an impact on the curve. Also shows the countries/state stage of the curve. #COVID19 #COVIDViz #COVID19
Tag: BI
Each year, Tableau invites users of the BI tool to nominate individuals in the community who have given back in so many ways to earn the coveted title of Zen Master. I’ve been using Tableau for three years now and while I’m not on the panel of judges that determine who becomes a Zen, I have my own idea of the attributes needed to become one. Granted I could nominate a large majority of the Tableau Community, I have nominated three users who have mentored me, inspired me, and with whom I hope to collaborate more in the near future.